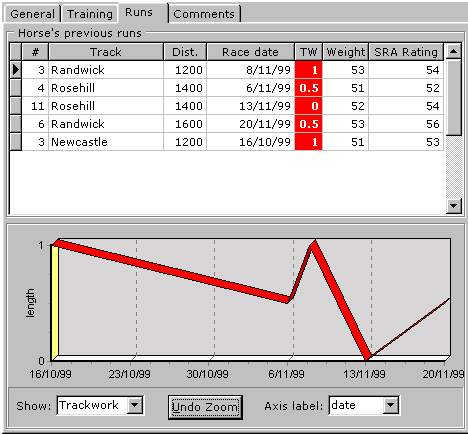
This is a very important, but a rather complex part of SRA-HD. With the help of the Graph at the bottom of the Runs form punters can really examine the trends in horses' runs! The Graph can show you three different data (trackwork , weight the horse carried and SRA Rating ) in three different systems (with different labels on the bottom axis.) It means 9 different charts !
Select the data (trackwork , weight the horse carried and SRA Rating ) you
should be looking in with the first drop-down list on the left bottom part of the Graph panel.
The right bottom drop-down list changes the label of the bottom axis. You can choose between the date of the race, the track name and the distance of the race.
The last filtering drop-down list in the 'Runs' toolbar effects the Graph as well. For example, if you were interested in a horse’s performance
for the last 3 month, you will see this data in the Previous Runs' Grid, as well as in the Graph below.
Finally you can Zoom in and out any part of the Graph!
Click on a desired part of the graph with the left button of your mouse and drag it until you see a white rectangle on the grey background of the graph. Release the mouse button and the
Graph will be Zoomed in.
If you drag the Graph with the right button of your mouse you will be able to move the Graph in any direction (up, down, left, right). It can come really handy when you
are already in the Graph's Zoomed in position..
Press [Undo Zoom] button to return the graph to its original size!